
Charts and Diagrams
ChatShell’s answers aren’t limited to text. When a picture says more than words, the assistant can put one right in its reply: a chart of prices, a diagram of a process, or a simple map of a trip.
What it can show
Section titled “What it can show”Charts
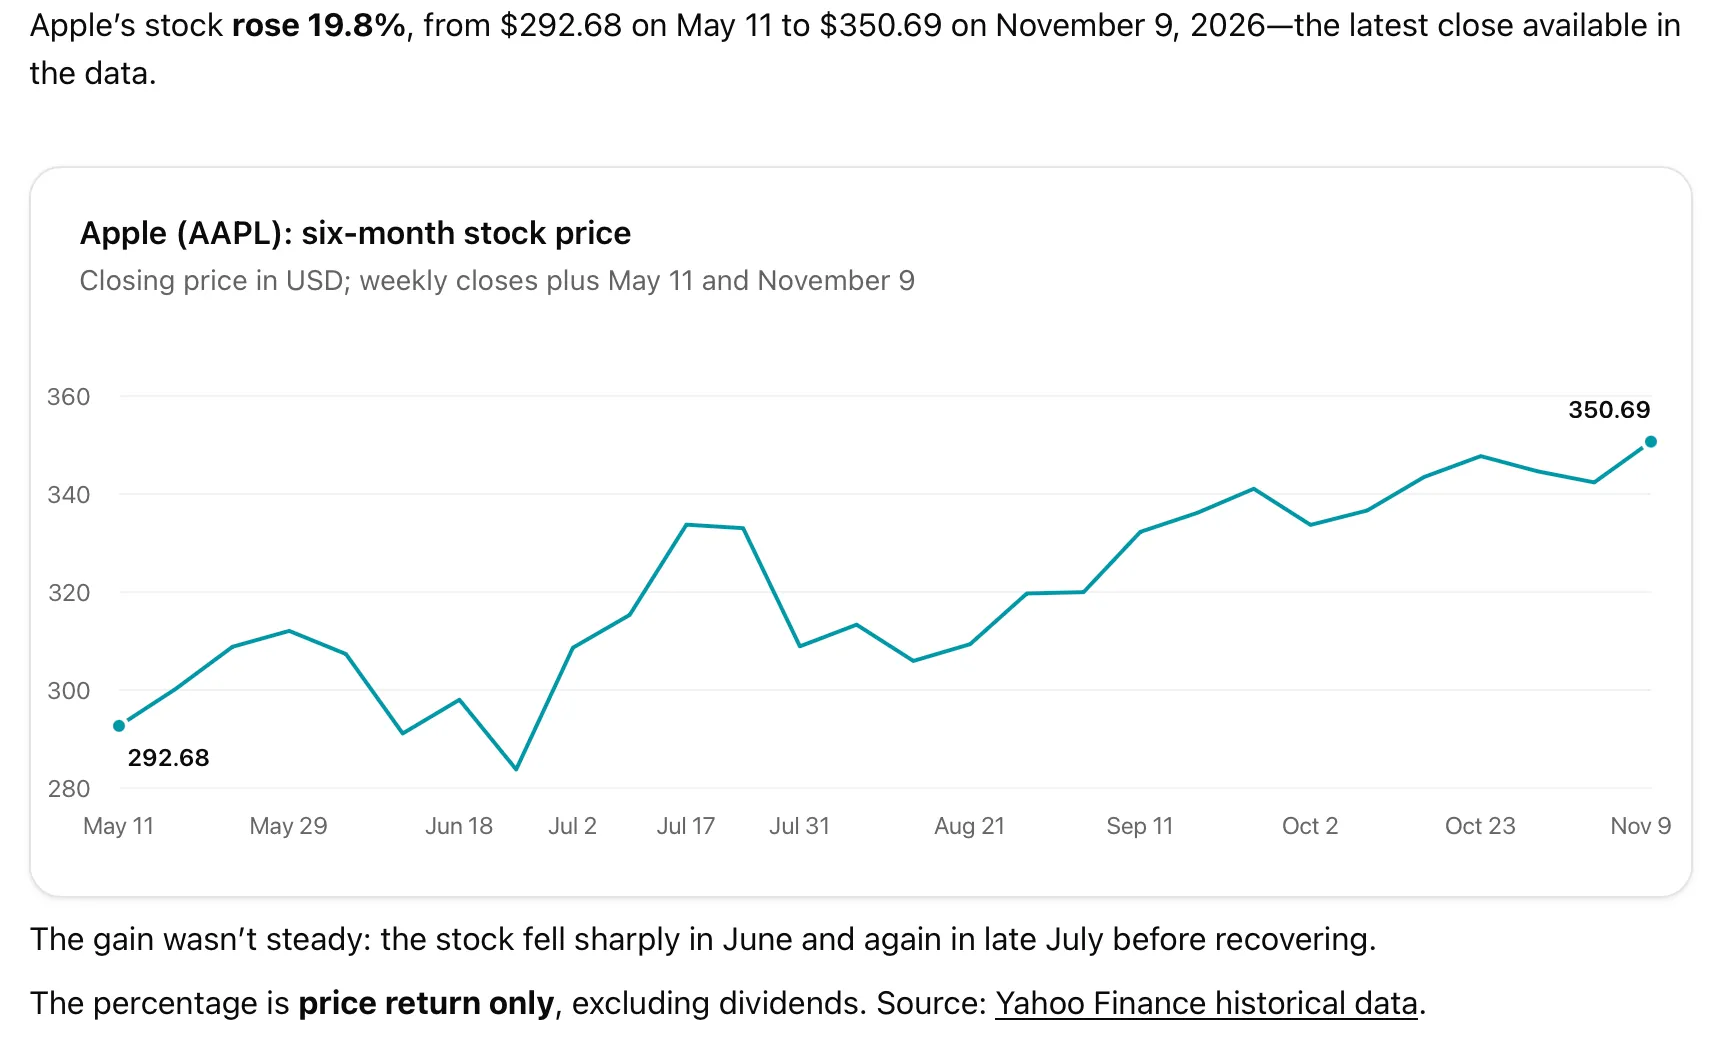
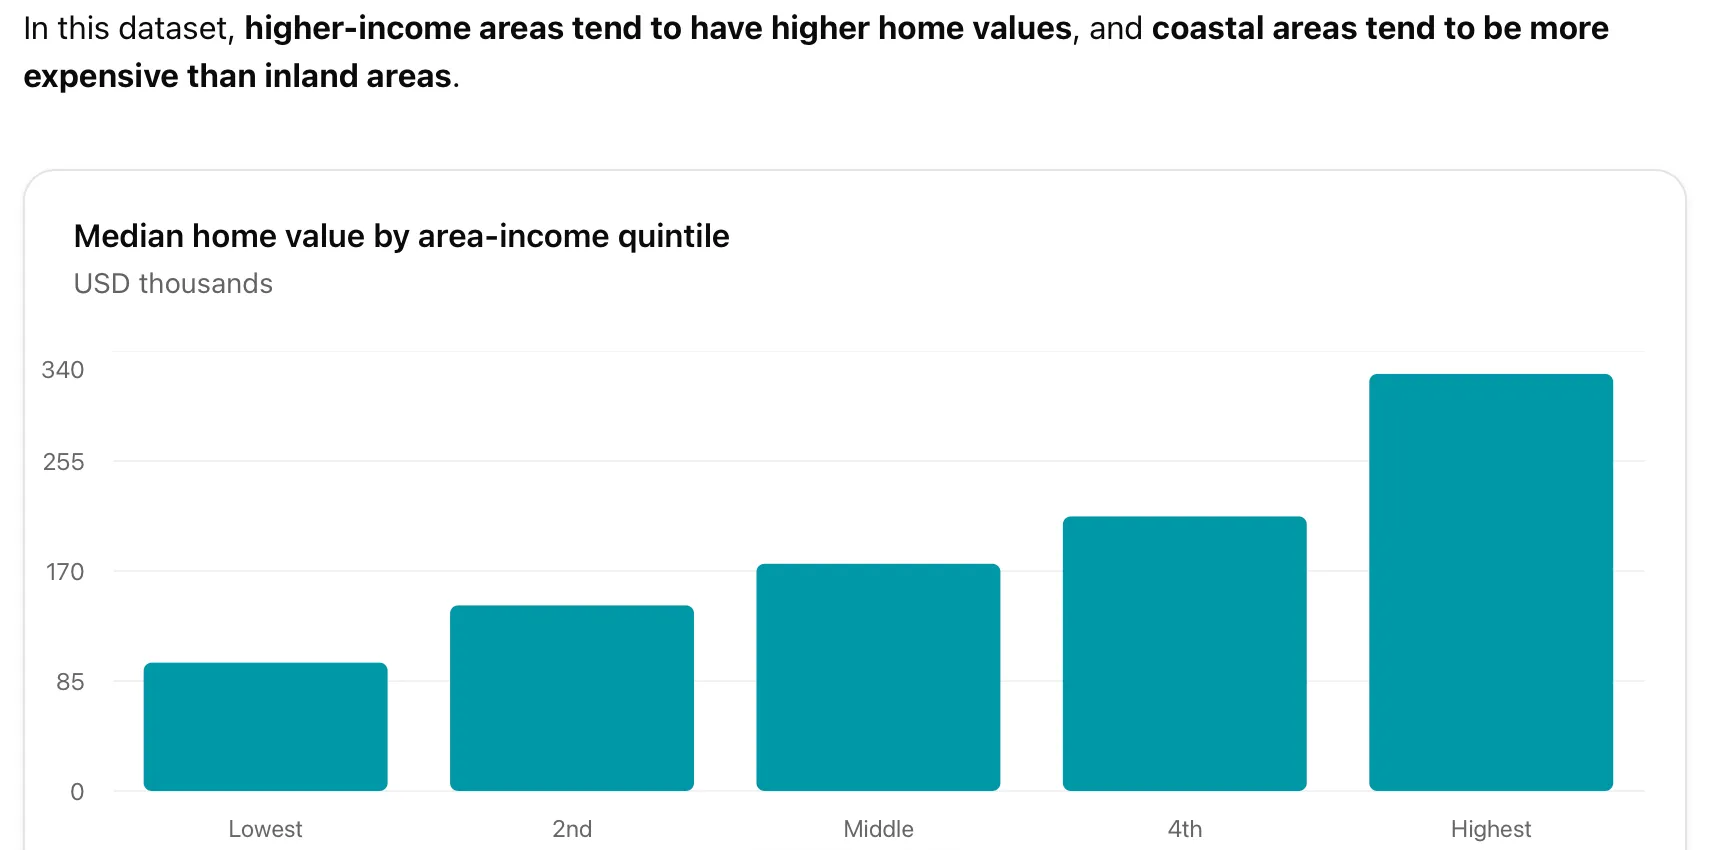
Section titled “Charts”Bar, line, area, pie, radar, and radial charts. Bars can be stacked or horizontal, and a pie can be a donut. Use them for trends over time, comparisons between groups, and shares of a whole.
KPI cards
Section titled “KPI cards”A row of two to four headline numbers, each with an optional change and comparison, such as Revenue $48.2k, +8.1% vs last month. Good for a quick summary before the details.
Diagrams
Section titled “Diagrams”Flowcharts, sequence diagrams, state diagrams, entity-relationship diagrams, class diagrams, and Gantt charts. Diagrams lay themselves out, so they suit anything that is boxes joined by arrows: a process, a plan, or how the parts of a system connect.
Figures
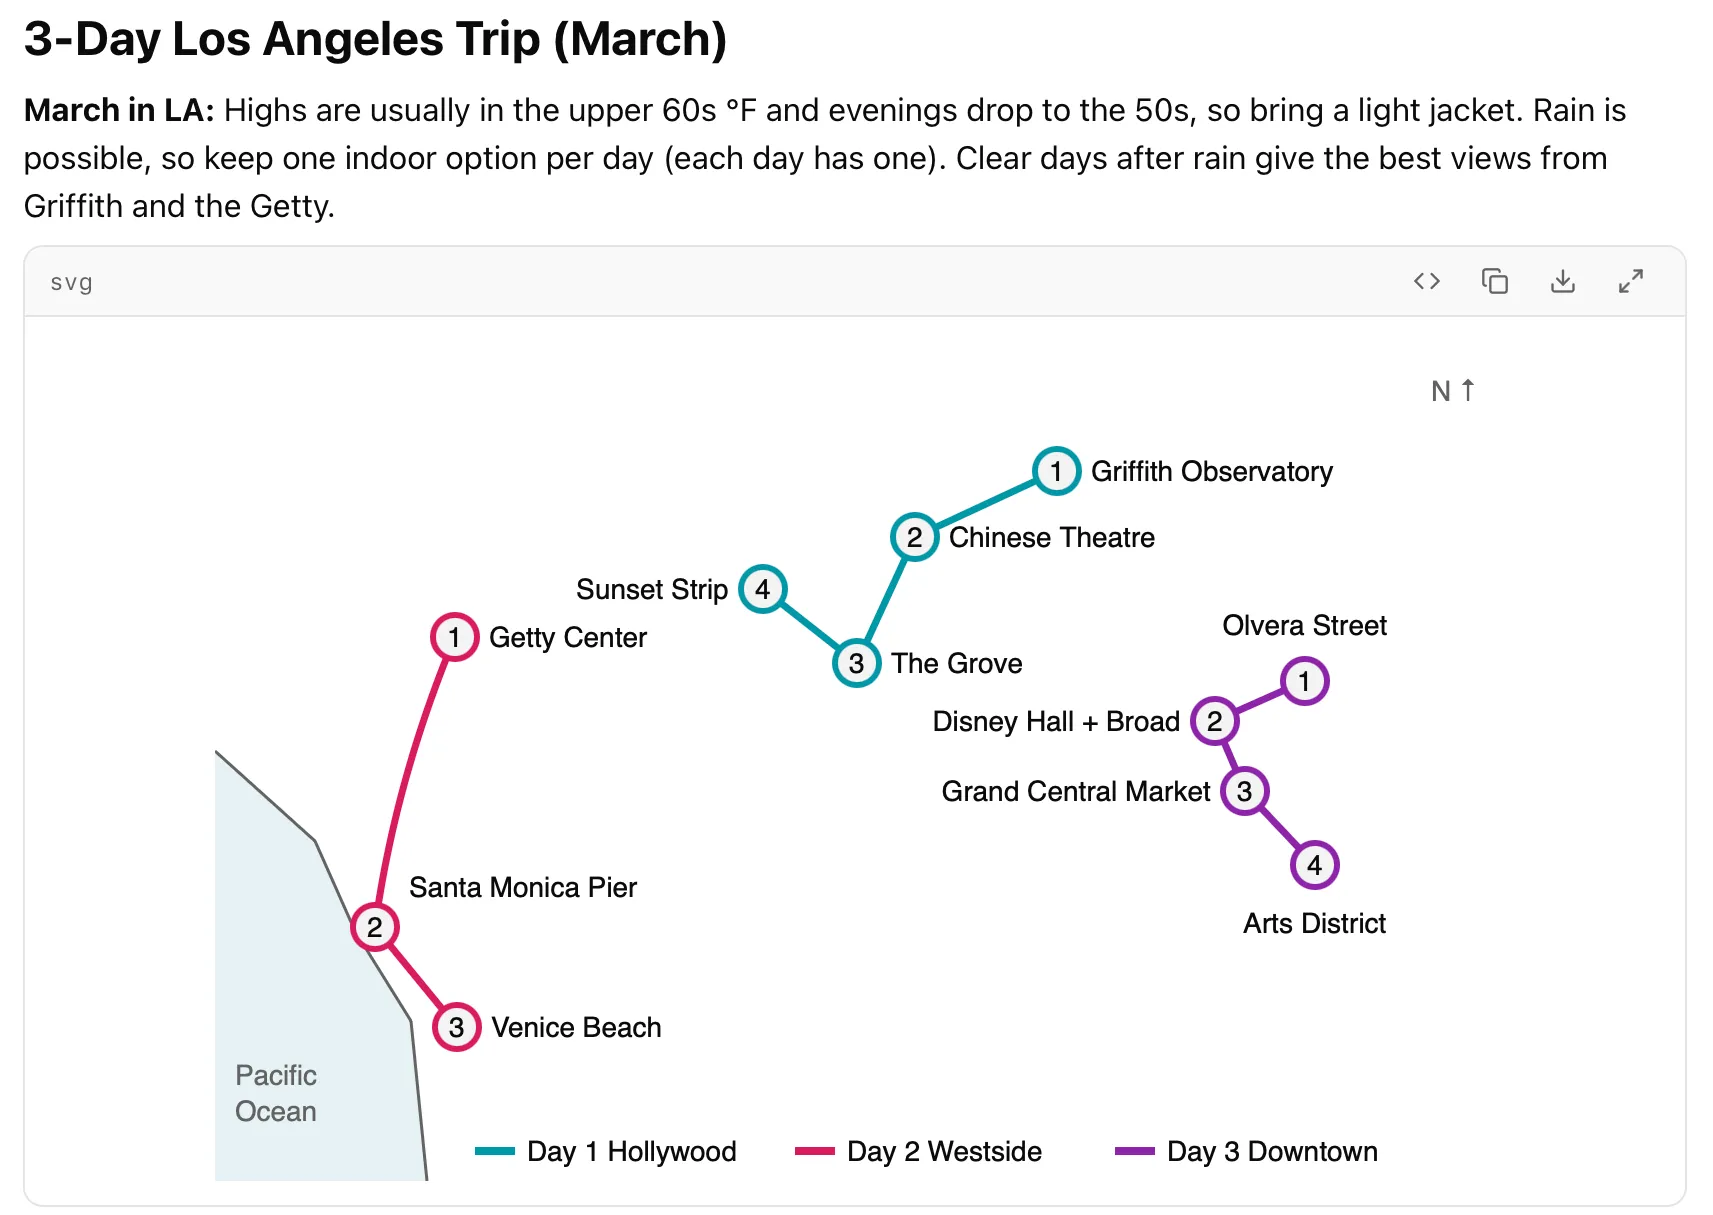
Section titled “Figures”Drawings for things that aren’t boxes and arrows: an illustration, a layout, a mockup of a screen, a simple map, or an animation that shows how something works. Each figure has controls to:
- Play animation or Pause animation
- Zoom in, Zoom out, or Open full size
- Show source to see the drawing’s code
- Copy code or Download as SVG to keep it
Math and tables
Section titled “Math and tables”Formulas display properly, inline or on their own line. A few exact values to read side by side go in a table.
Charts, figures, and diagrams share one color palette that follows light and dark mode.
When the assistant uses them
Section titled “When the assistant uses them”The assistant adds a visual only when it says more than the text would. It won’t draw a chart that just repeats the sentence above it. Roughly:
| What the answer contains | What you get |
|---|---|
| A trend, a comparison, or a share of a whole | A chart |
| A few headline numbers | KPI cards |
| A few exact values to compare | A table |
| Steps, a process, or connected parts | A diagram |
| A shape, a layout, or a place | A figure |
| Anything else | Text |
How to ask for one
Section titled “How to ask for one”- Say what you want. If you want a picture, ask: “Show me a chart.” A question like “What makes these homes cost more?” may get a clear written answer and no chart.
- Say “one” to get one. “With one map showing all three days’ routes” gets a single map. “With a map for each day” can get three.
- Ask it to check the numbers. A chart is only as right as the data behind it. For prices, dates, and statistics, add “Check that each date matches its value.”
Limits
Section titled “Limits”- Maps are drawings, not street maps. They show roughly where places are and the order of stops, not to scale. Use a map app for directions.
- Charts and cards only display data. Nothing in them can be clicked, filled in, or sent. The assistant asks questions and suggests next steps in the text.
- Trust the legend over the words. The assistant may describe a route as “blue” when the app draws it in another color from the palette. A legend’s colors always match the drawing, so go by the legend.
Turn them on or off
Section titled “Turn them on or off”Open Settings → Visuals:
| Setting | What it controls |
|---|---|
| Render SVG figures | Figures: drawings, mockups, maps, and animations |
| Chart and data blocks (OpenUI) | Charts and KPI cards. Adds about 600 tokens to every request, which matters if you pay your provider per token |
When a setting is off, the assistant isn’t asked to draw that kind of visual, and any that arrive show as code. Diagrams and math have no setting; they always display.
Safety
Section titled “Safety”- Diagrams are drawn in Mermaid’s strict security mode.
- Figures are shown as images, so nothing inside them can run, and they can’t load anything from the internet.
- Charts and KPI cards only display data; nothing in them opens links or sends messages.